
About Us
Solution
Product
Contact

Helios Robot
Register Now
Data Drawing
More convenient than Excel
The visualization of experimental data is an important process in the design work. Help you easily produce beautiful diagrams through online drawing tools.
Learn More
The files accessed from the network analyzer should be saved in dB phase format. Upload directly in the following section to automatically create a plot.
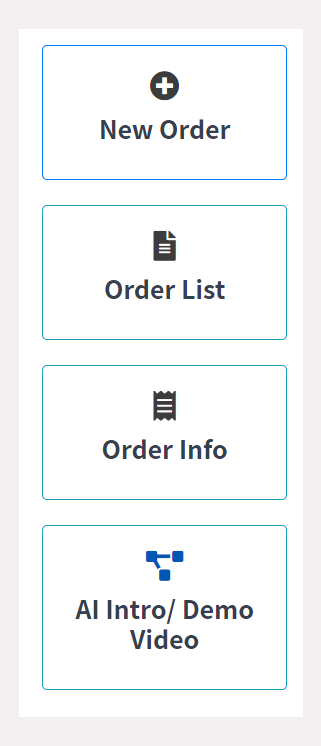
The first step of data drawing
Upload files directly
The files accessed from the network analyzer should be saved in dB phase format. Upload directly in the following section to automatically create a plot.
Learn More
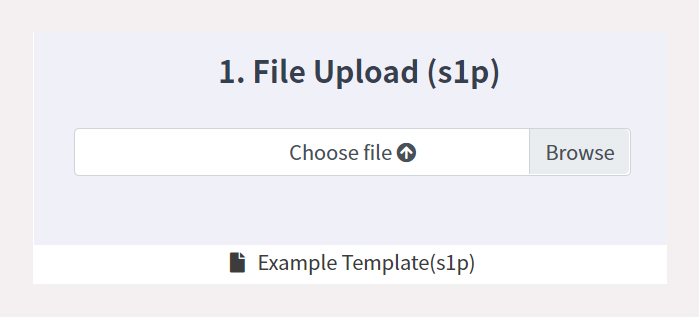
If you are not sure about the format, you can download the Example Template(s1p) to check and confirm. Also use this file upload directly for testing.
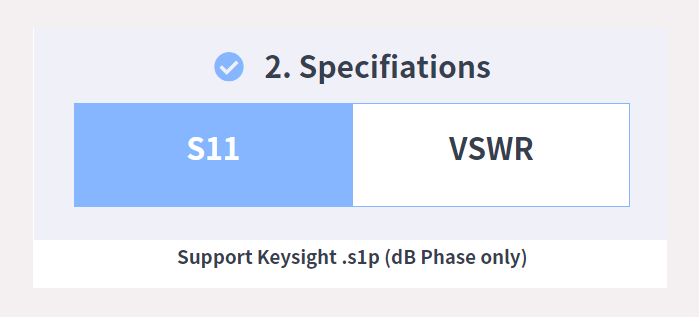
The second step of data drawing
Choose a drawing format
You can choose S11 or VSWR format for drawing, and click the button to switch.
Learn More
The interval of S11 is 0~-20dB, and the frequency band is 0~8GHz
The range of VSWR is 0~10, and the frequency band is 0~8GHz
The range of VSWR is 0~10, and the frequency band is 0~8GHz
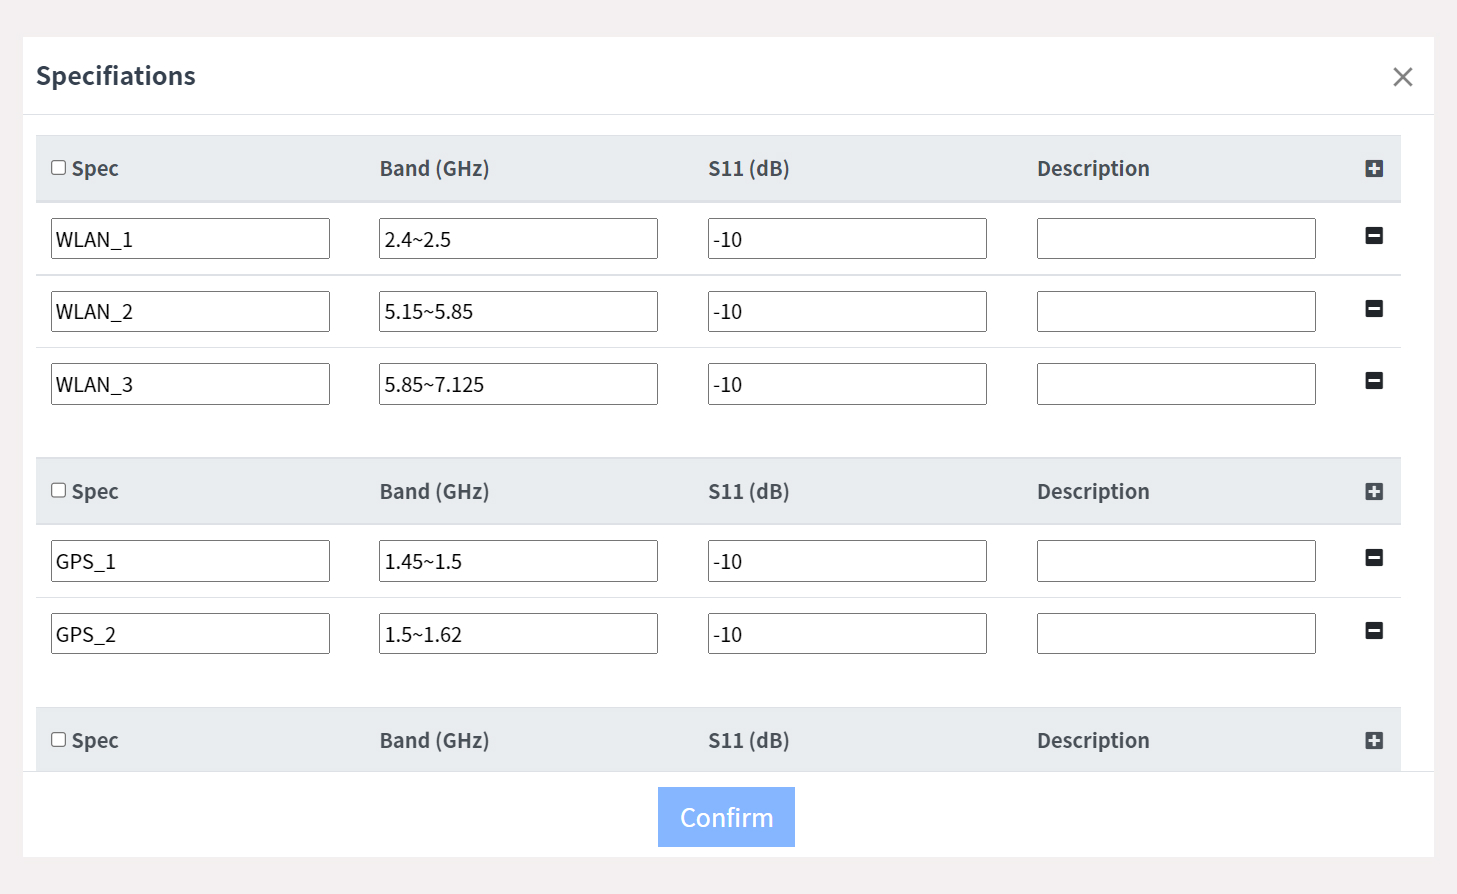
The third step of data drawing
Select frequency band and specification
Built-in multiple frequency bands and specifications for you to quickly select
Learn More
Select the interval data you need, click V, and the content in the selection table can be manually modified after changing color
If you need to increase the frequency band, you can click "+" to generate a new blank form. Please manually modify the similar format to complete the setting
To remove the frequency band, click "-"
If you need to increase the frequency band, you can click "+" to generate a new blank form. Please manually modify the similar format to complete the setting
To remove the frequency band, click "-"
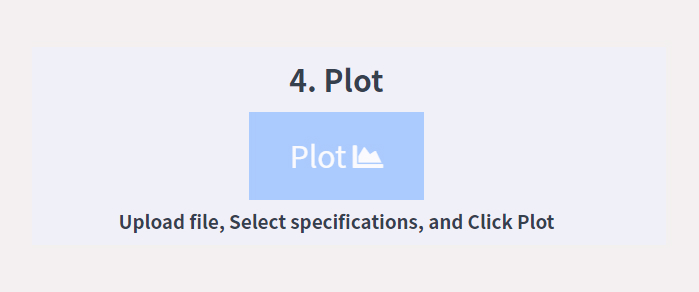
The fourth step of data drawing
Draw now
After clicking this button, the system will start drawing automatically
Learn More
If the format of the previous steps is incorrect or the s1p data file is missing, the button will not be able to click to draw.
Correct execution will render the following format.
Correct execution will render the following format.
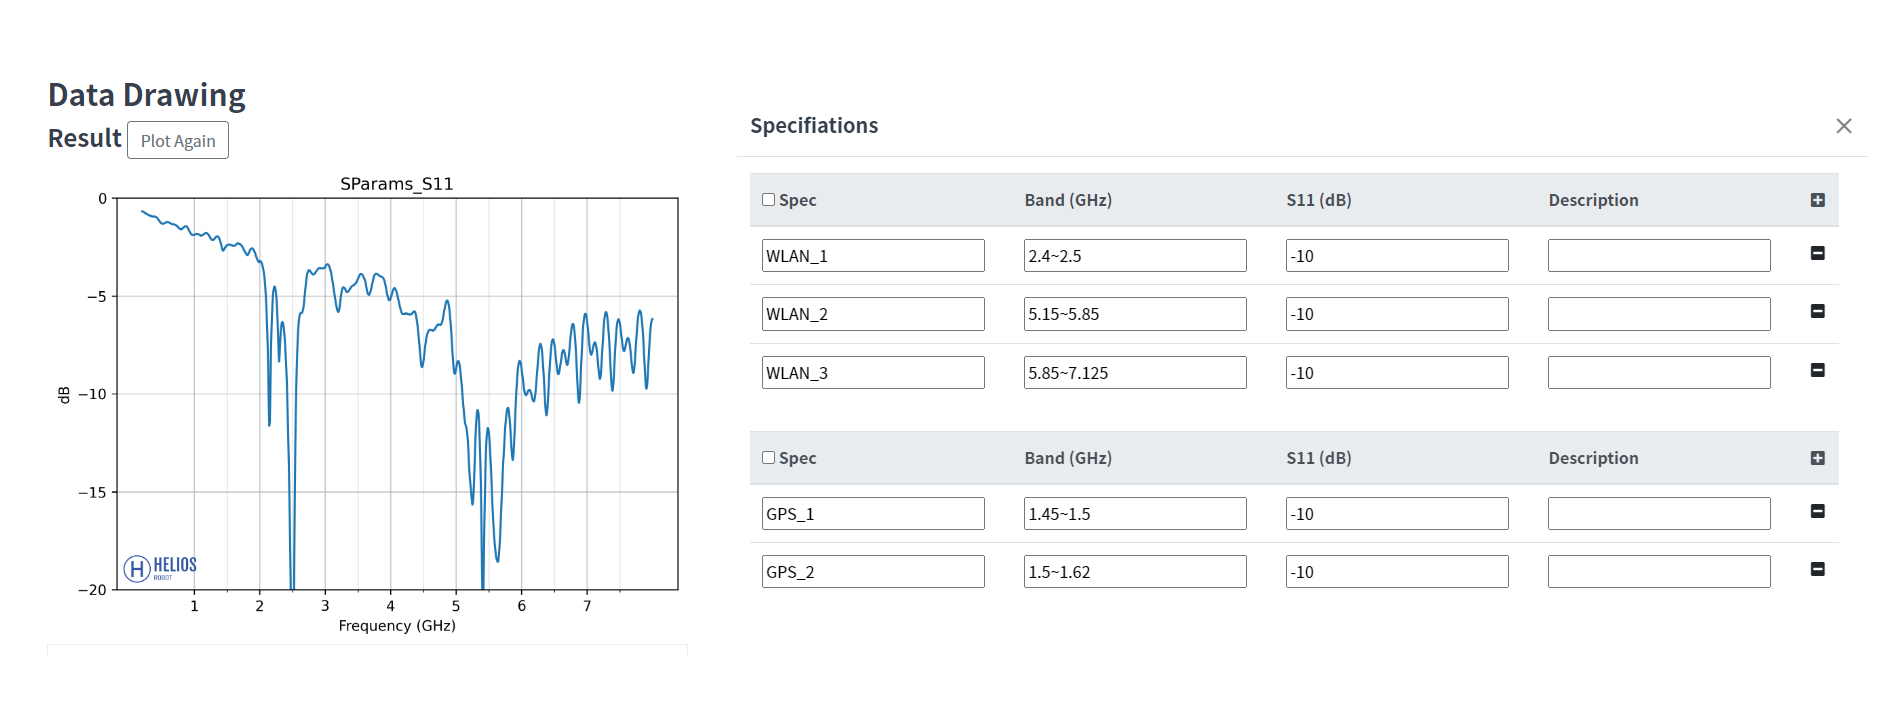
The fifth step of data drawing
View results
There are different pictures and table contents for you to browse
Learn More
The frequency band information is presented in the table on the right
- Different colors represent different frequency bands
- Specifications are automatically marked within the interval